


Outline of exhibition
This exhibition visualizes Earth data collected from around the world. Let's observe the Earth on which we live, and explore the past, present, and future.
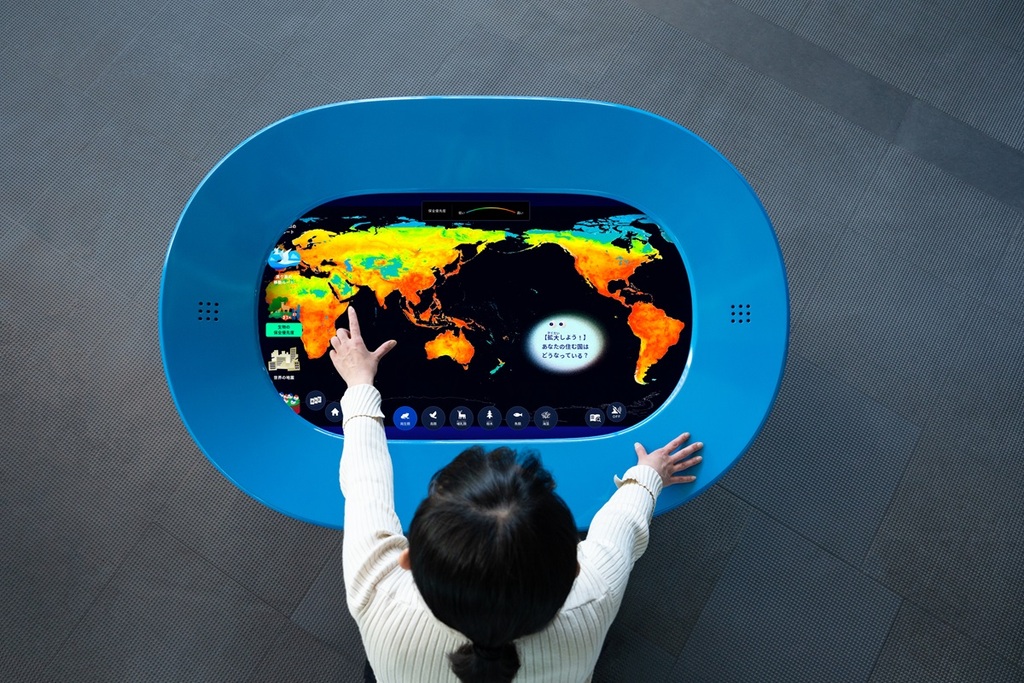
This exhibition visualizes scientific data provided by research institutions around the world, including data on human activities and dynamic changes in the global environment. You can freely explore information on a global scale by operating dedicated terminals designed to look like telescopes.
Let's observe the Earth on which we live from various perspectives.
Let's observe the Earth on which we live from various perspectives.


Highlights and details
Route of Movement of Migratory Birds
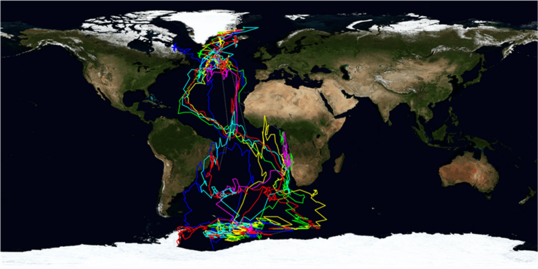
Birds that change where they live depending on the season are called “migratory birds.” Arctic tern is the longest migratory bird in the world. Their migration route can be viewed. The arctic tern travels 80,000 km round trip from Greenland to Antarctica each year.
Aerosol Concentration
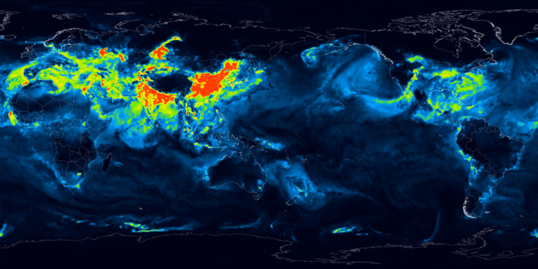
Microscopic particles in the atmosphere, such as pollen and exhaust gases, are called “aerosols.” Aerosols are known to affect global warming and human health. The data on aerosol concentrations emitted by human activities can be viewed.
Tremors Before and After the Great East Japan Earthquake
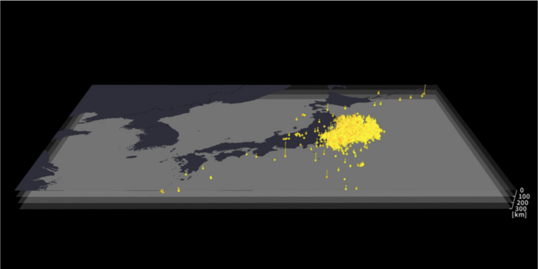
The Great East Japan Earthquake, which occurred in 2011 is the fourth largest earthquake recorded in the world since 1900. Earthquakes that occurred in Japan and surrounding areas in the month before and after can be viewed with their magnitudes and epicenter depths.
Enjoy Geo-Scope by sound
One of the five terminals is equipped with the "Enjoy Geo-Scope by Sound" mode, which expresses data through sound. Each dataset is represented by sounds based on predetermined rules such as volume and frequency, allowing visitors with visual impairments to understand and enjoy the content through sound.